|
Inferno
|
|

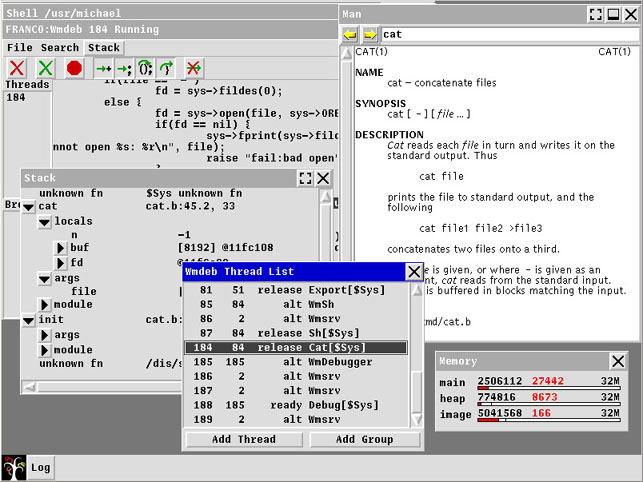
Inferno running the graphical debugger, memory monitor and manual viewer. The graphical debugger has three windows, the top window shows a list of the currently executing threads. Once a thread has been selected, the other two windows display the variable stack and the current location within the source code.
back to screenshots
|
